ABCD Pattern
The ABCD Pattern is the most basic and the easiest pattern to trade, and it is an excellent choice for beginner and intermediate traders. Although it is simple and has been known for a long time, it still works very effectively because many traders are still trading it. As mentioned earlier, it has a self-fulfilling prophecy effect. You should do whatever all of the other traders are doing because a trend is your friend. A trend may very well be your only friend.
Let’s take a look at this pattern:

Example of an ABCD Pattern.
ABCD Patterns start with a strong upward move. Buyers are aggressively buying a stock from point A and making constantly new highs of the day (point B). You want to enter the trade, but you should not chase the trade, because at point B it is very extended and already at a high price. In addition, you cannot say where your stop should be. You must never enter a trade without knowing your stop.
At point B, traders who bought the stock earlier start slowly selling it for profit and the prices come down. Still you should not enter the trade because you don’t know where the bottom of this pull back will be. However, if you see that the price does not come down from a certain level, such as point C, it means that the stock has found a potential support. Therefore, you can plan your trade and set up stops and a profit taking point.
Let’s take a look at Ocean Power Technologies Inc. (ticker: OPTT) at July 22, 2016, when they announced that they had a new $50 million contract to build a new ship (There’s a fundamental catalyst! Remember Chapter 2?).
The stock surged up from $7.70 (A) to $9.40 (B) at around 9:40 a.m. I, along with many other traders who had not heard the news, waited for point B and then a confirmation that the stock wasn’t going to go lower than a certain price (point C). When I saw that point C was holding as a support and buyers wouldn’t let the stock price go any lower than $8.10 (C), I bought 1,000 shares of OPTT near C, and my stop was below point C. I knew that when the price went higher, closer to B, buyers would jump on massively. As I mentioned before, the ABCD Pattern is a very classic strategy and many retail traders look for it. I purchased stock between points B and C. Close to point D, the volume suddenly spiked, which meant that traders had jumped into the trade.
My exit would be when the stock made a new low, which was a sign of weakness. As you see, OPTT had a nice run up to around $12.
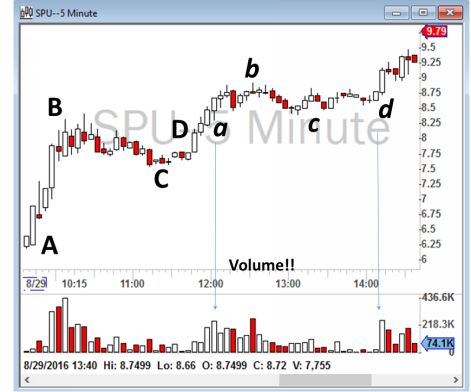
Let’s look at another example, this time for SPU on August 29, 2016. There are actually two ABCD Patterns. I marked the second one as abcd pattern. Usually as the trading day progresses volumes become lower and therefore the second pattern is smaller in size. Please note that you will always have high volumes in points B and D (and of course points b and d in this example).

Example of ABCD Pattern and abcd pattern.
To summarize my trading strategy for the ABCD Pattern:
- When I observe with my scanner or I’m advised by someone in our chatroom that a stock is surging up from point A and reaching a big new high for the day (point B), I wait to see if the price makes a support higher than point A. I call this point C. I do not jump into the trade right away.
- I watch the stock during its consolidation period. I choose my share size and stop and exit strategy.
- When I see that the price is holding support at level C, I enter the trade close to the price of point C in anticipation of moving forward to point D or higher.
- My stop is the loss of point C. If the price goes lower than point C, I sell and accept the loss. Therefore, it is important to buy the stock close to point C to minimize the loss. Some traders wait and buy only at point D to make sure that the ABCD Pattern is really working. In my opinion that is reducing your reward and increasing your risk.
- If the price moves higher, I sell half of my position at point D, and bring my stop higher to my entry point (break-even).
- I sell the remaining position as soon as my target hits or I feel that the price is losing steam or that the sellers are acquiring control of the price action.
All other strategy link if app doesn't open
If apps button not working then you can click below link to read all chapters